Power BI is a powerful controlling tool for the entire organization. This includes strategy controlling, portfolio controlling, and project controlling, among other areas.
Report templates for project controlling with Power BI
Effective project controlling ensures that project goals are achieved and that the course of the project stays under control. Key components of project controlling are target-actual comparisons and variance analyses to assess consequences and propose corrective measures. The focus is, among other things, on which resources a project requires and whether project goals and project costs are being met.
With Microsoft Power BI and Microsoft Power BI Paginated Reports, you keep the entire project team up to date. The reports are easy to use. With Power BI, even end users can easily create their own ad hoc analyses. This gives project managers, executives, the project office, and project controllers in particular the ability to answer all questions about ongoing projects and the resources deployed — without IT support.
To get you started, Microsoft provides free Power BI report templates for project portfolio controlling, project controlling, and resource controlling. You can use these out of the box with Microsoft Project Online and Microsoft Planner Premium. Since Project Online has been discontinued by Microsoft, the question arises of how data from Microsoft Project can continue to be visualized. But first, let's look at the free Power BI reports from Microsoft.
Report templates for Microsoft Project and Planner Premium
Installing the free templates for project controlling with Power BI
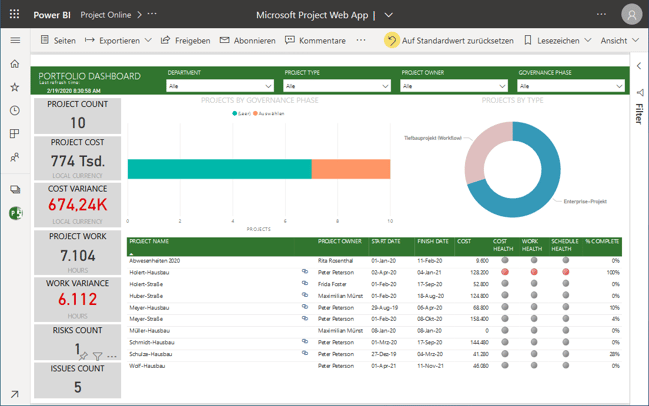
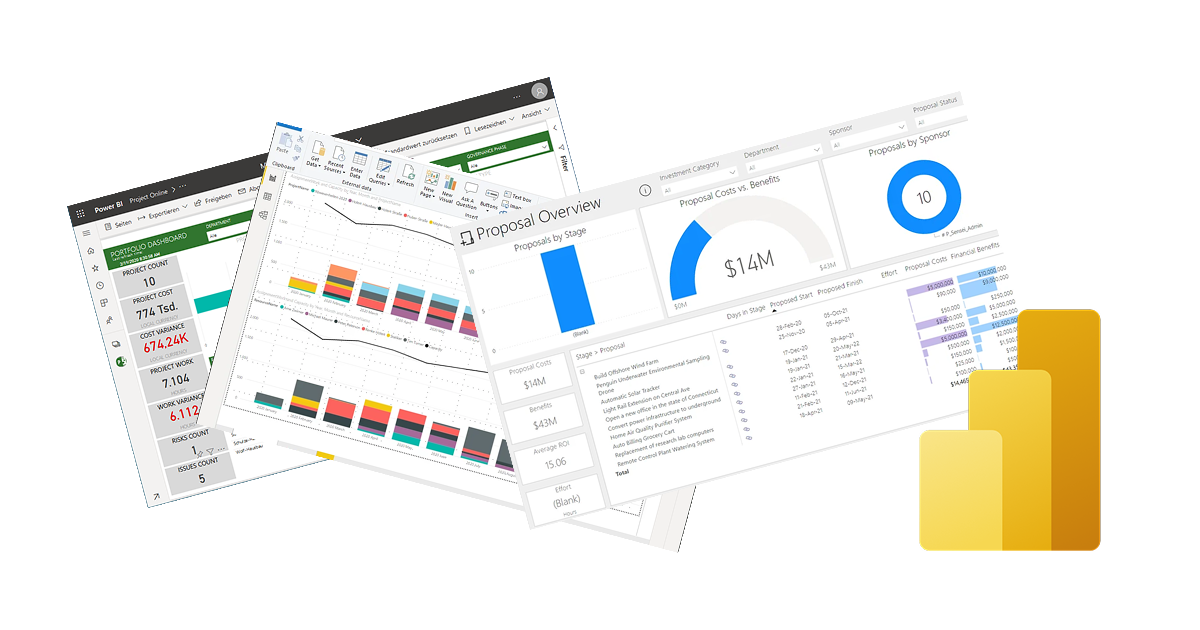
For users of Microsoft Project Online and Planner Premium, Microsoft offers free templates for project controlling. They include a whole series of useful reports that give you an immediate start into project controlling with Power BI. As an example, the screenshot shows the Portfolio Dashboard report.
Customizing the free templates for project controlling with Power BI
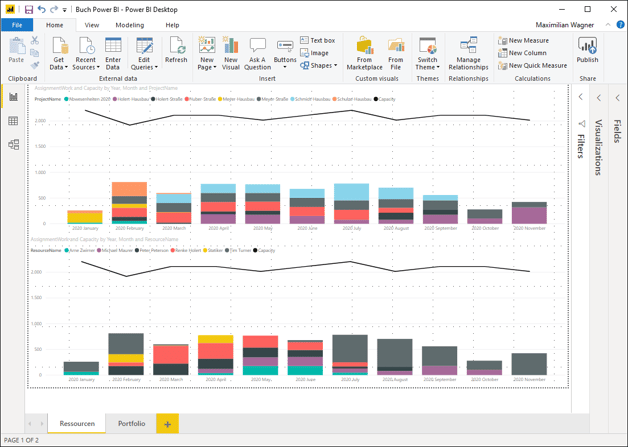
You can also customize Microsoft's report templates yourself or build entirely independent reports on the data from Microsoft Project Online or Planner Premium. For this, you can use Power BI Desktop, for example.
Below is an example report for project controlling, the resource histogram. The upper half shows resource utilization and capacity grouped by project, and the lower half grouped by resource.
You can use Power BI reports in any modern web browser, in Microsoft Teams, and on mobile devices in the Power BI app for Android and iPhone or iPad.
Comprehensive controlling at the strategy, portfolio, program, project, and resource level with Power BI
But how can you build a comprehensive controlling solution beyond that — at the strategy, portfolio, program, project, and resource level with Power BI and Fabric — that visualizes project data from Microsoft Project, Microsoft Planner Basic plans and Microsoft Planner Premium plans, Azure DevOps, and Jira, and is independent of the discontinued Project Online?
For this, Altus delivers ready-made, immediately usable reports that, through the integration of Altus with Microsoft Project, Microsoft Planner Basic plans and Microsoft Planner Premium plans, Azure DevOps, and Jira, enable unified controlling. Below is a selection of the included reports:
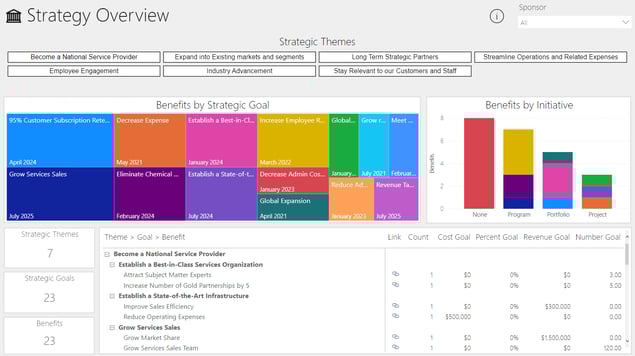
Strategy controlling with Power BI
Overview of the value contribution of all projects to the strategic goals, organized by strategic themes.
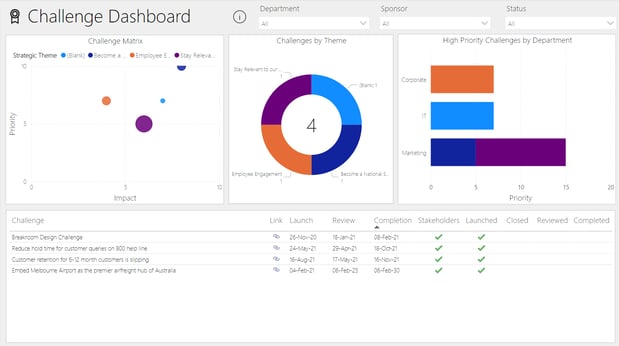
Innovation controlling with Power BI
The Challenge Dashboard displays the challenges, or problem spaces, that the company wants to solve, organized by strategic goals. The strategic goals themselves are bundled into themes
Overview of all ideas for mastering the defined challenges in the best possible way.

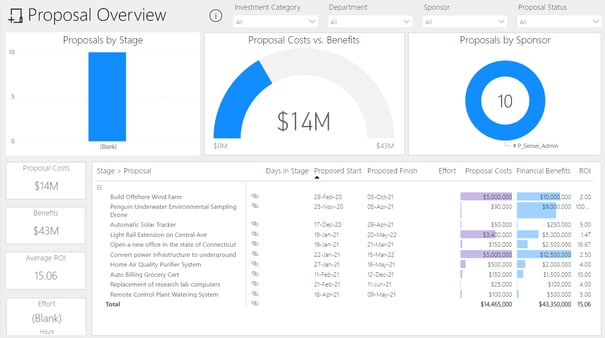
Portfolio controlling with Power BI
Overview of submitted project proposals
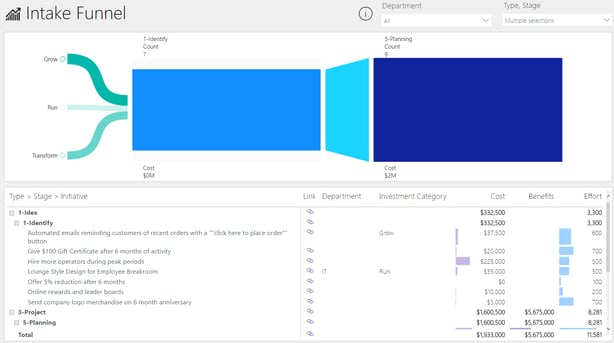
Funnel of new project proposals and projects, displayed by project lifecycle, phase, and approval stage
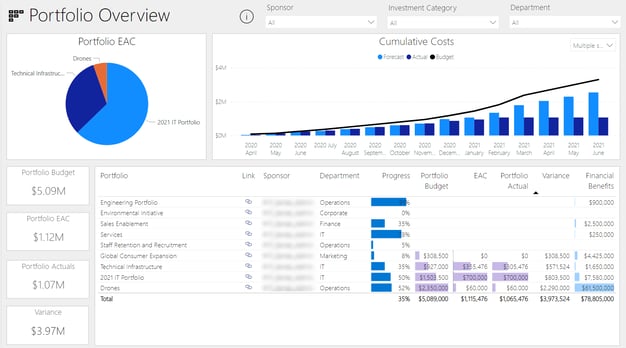
Overall view of all portfolios, including the IT portfolio (projects and agile initiatives)
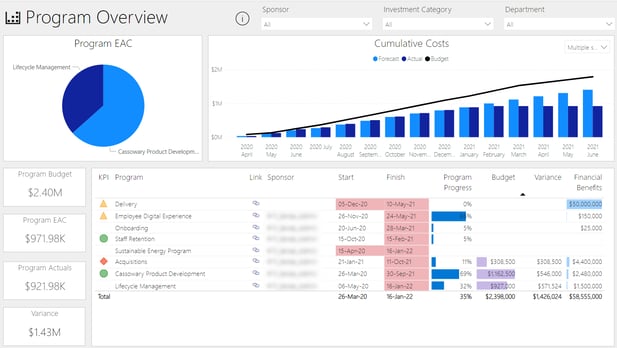
Program controlling with Power BI
Program overview for cost controlling and schedule controlling with Power BI
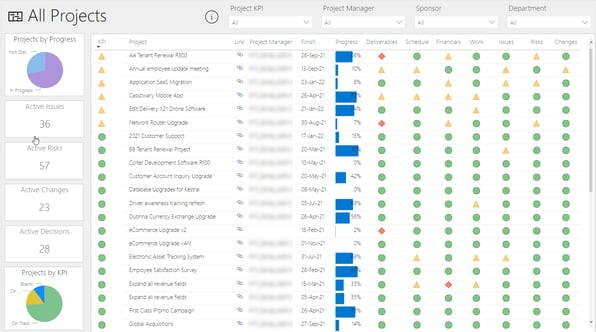
Project controlling with Power BI: project overview with KPIs and milestone overview
Overview of all ongoing projects from Microsoft Project, Planner Basic, Planner Premium, Azure Boards, Azure DevOps, and Jira, including KPIs. These are integrated by Altus out of the box and can be displayed in a single overview.
Overview of all milestones, e.g. filtered by department or project manager

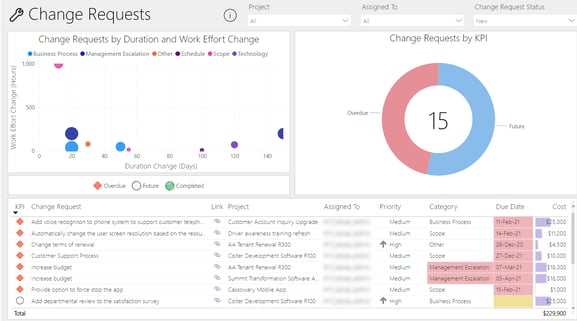
Change requests and RFCs
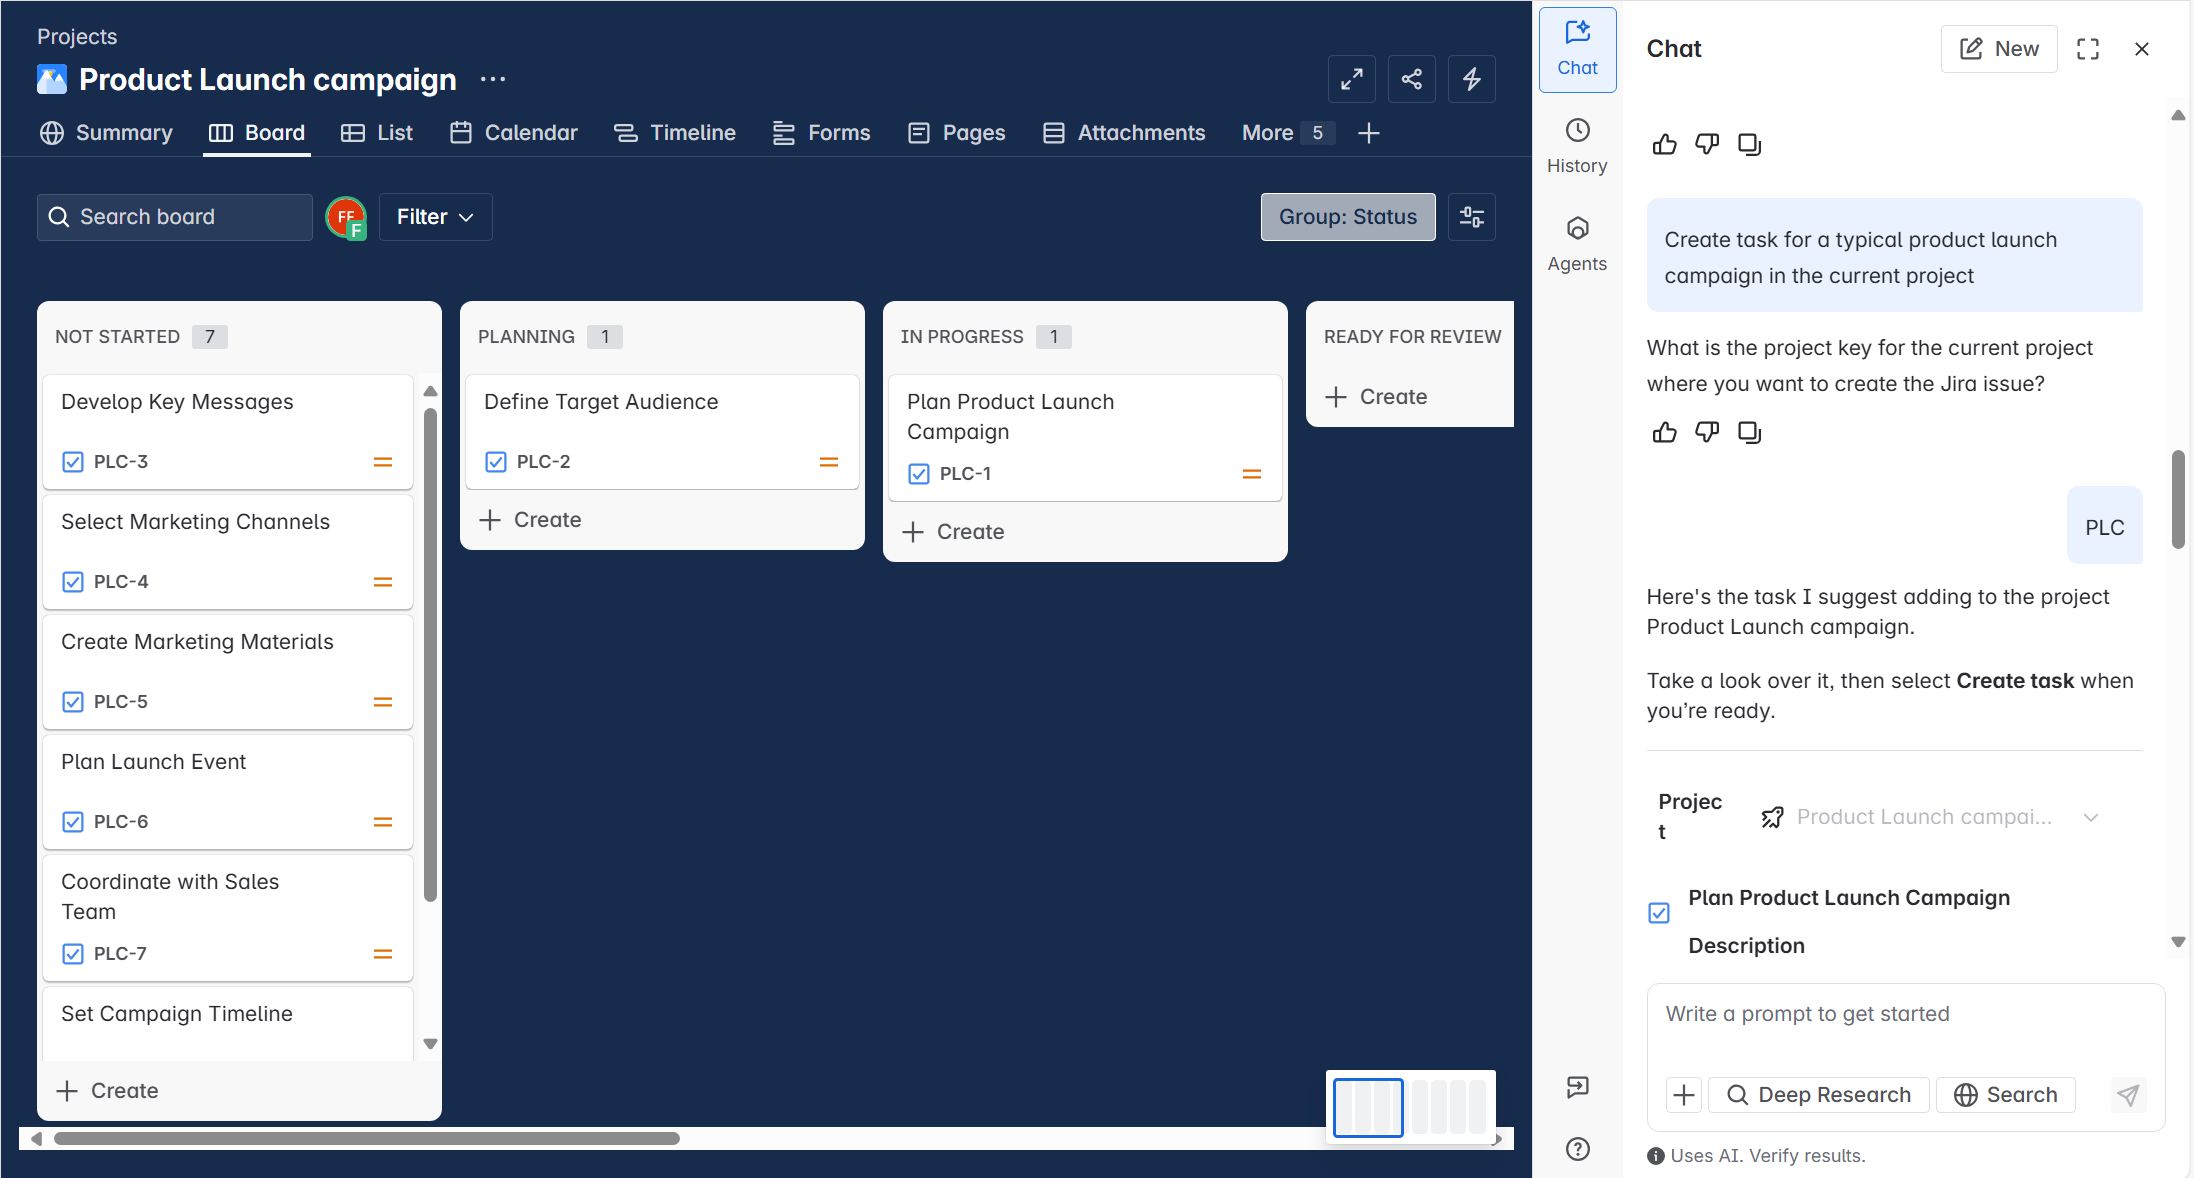
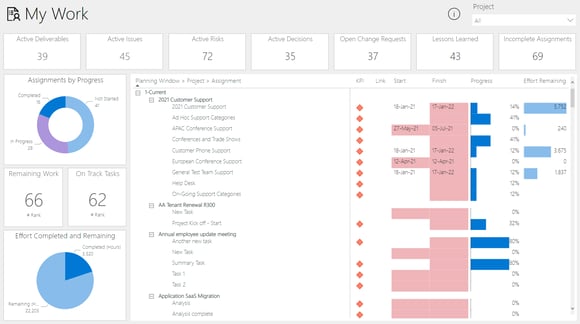
A cockpit for your own tasks with Power BI
An overview of your personal work backlog containing all tasks from Microsoft Project, Microsoft Planner, Microsoft Planner Premium, Azure DevOps, and Atlassian Jira. In addition, there are complementary overviews of all deliverables, issues, risks, decisions, change requests, and lessons learned.
How can I create a cross-project analysis of all tasks from Microsoft Planner?
Microsoft Planner Basic plans store their data in the Planner app of Microsoft 365 and do not provide a data source for building Power BI reports by default. Planner Premium plans store their data in Dataverse. Dataverse can easily be used as a data source for Power BI. With Altus, you can analyze the data from Planner Basic and Planner Premium together.
Extend your reports and add further data sources from your organization.
Power BI gives you the option to choose from a wide range of connectors and to connect additional data sources from your organization without deep programming experience.

Databases such as SQL Server, Oracle databases, or SAP HANA databases can be connected.

Connectors for online services such as Salesforce or Google Analytics are also available.
This is just a selection of the connectors available in Power BI that enable you to access your data without major programming skills.
 Renke Holert